
Claude meets JSON: Automating Databricks Dashboards
Dashboard Automation with Claude Code


Introduction
This blog post is the third in a series focused on end-to-end data ingestion and transformation with Databricks, based on the principles of the Medallion architecture. The project will feature the vehicle datasets published by the Dutch RDW (national vehicle authority) and is aimed to exemplify a basic data processing workflow using core Databricks functionalities. This blog will focus on Dashboard creation using Claude code, similarly you can use any LLM of your choice.
The entire blog series consists of:
Blog 1: Data Ingestion Framework & Medallion Architecture - The secrets of bronze, silver, and gold
Blog 2: Data Quality Checks with DQX - DQX: We do not trust the data we have not validated
Blog 3: Dashboard Automation with Claude Code - Claude meets JSON: automating Databricks dashboards
Blog 4: Companion App for Data Exploration - You need a companion to explore your data
Blog 5: Asset Bundle Deployment - Deploy your project like a pro with Databricks Asset Bundles
Blog 6: Cost Optimization & Analysis - It’s all great, but how much does it cost?
Databricks JSON dashboards
Databricks dashboards provide a native way to visualize data directly from Unity Catalog tables. They support a range of chart types, filters, and parameters which can be configured through a visual editor within the workspace.
Databricks dashboards consist of a few key components:
Datasets: SQL queries that pull data from your tables. Each dataset is referenced by widgets.
Widgets: The individual visualizations (counters, bar charts, line charts, tables) plus text and filter elements.
Layout: A grid-based positioning system where you specify x, y, width, and height for each widget.
Each dashboard is structured as a JSON file on the backend. The JSON follows a predictable pattern: you define your datasets first, then create widgets that reference them and specify visualization options. The basic structure looks like:
json
{
  “datasets”: [
    {
      “name”: “vehicle_count”,
      “query”: “SELECT COUNT(*) as total FROM gold_layer.rdw_etl.registered_vehicles”
    }
  ],
  “widgets”: [
    {
      “name”: “Total Vehicles”,
      “type”: “counter”,
      “dataset”: “vehicle_count”,
      “column”: “total”,
      “position”: {”x”: 0, “y”: 0, “width”: 3, “height”: 2}
    }
  ]
}
Existing dashboards can be exported to retrieve their JSON files. Databricks has also added support for Git version control in dashboards (have to live in Git folders), where the underlying JSON changes get tracked. That said, the JSON is designed as a storage medium rather than a file intended for direct editing.
That is not to say that it is impossible to alter your dashboard by directly modifying the JSON, but it definitely is very impractical and tedious to do so, hence it is not really recommended. The Databricks UI editor remains far more usable for actually building and modifying dashboards. Adjusting layouts, adding pages and configuring is much more intuitive through a visual interface, compared to scrolling through nested JSON properties.
This project was in part inspired by the realisation that the AI assistant provided by Databricks does not yet offer extensive capabilities in this regard. It can help generate individual widgets, but it can’t handle broader operations like creating new pages, rearranging the layout, or even automatically defining datasets from your tables (at least, not directly from the UI). As such, building dashboards with LLM assistance is still somewhat limited.
Using Claude Code
Given these current limitations on using the assistant with dashboards, we turned to Claude Code for dashboard development. The approach was simple; the exported JSON of the existing dashboard was placed in the project structure (dashboard/src/rdw_dashboard.lvdash.json). To sync it easily with our deployed asset bundle, it was also defined in databricks.yml:
yaml
 dashboards:
   rdw_dashboard:
     display_name: “RDW Dashboard”
     file_path: dashboard/src/rdw_dashboard.lvdash.json
     warehouse_id: ${resources.sql_warehouses.serverless_warehouse.id}
Note that you need to attach a warehouse in the dashboard definition.
It was then possible to examine our dashboard using Claude by reading the JSON. From here you can prompt Claude Code to modify the JSON in any way. For example, you can add new widgets, adjust queries or reorganize the layout.
Especially in the beginning the changes by Claude were not always correct. These issues were largely caused by Claude not being fully familiar with the syntax conventions used in Databricks dashboards. Field names, default values, and structural patterns would sometimes drift from what the platform expects. Rather than correcting these issues manually each time, we found it more effective to set up a Claude agent that had more knowledge about the syntax and conventions used by Databricks dashboard JSONs (you can probably use Claude skills as well here). This kept the output closer to what Databricks produces natively and reduced the back-and-forth during import.
What is also great about this approach is that both UI widgets and data sources can be updated in an instance. If the data or aggregations that your widget relies on is not (yet) available, Claude can define it at the same time in datasets using SQL queries.
Since we are adjusting the local clone of our dashboard’s JSON, it is not really possible to view the changes in real time. In our setup we used the dashboard attached in the DAB and deployed it to Databricks after changing, using databricks bundle deploy … command. This does mean that you have to refresh your browser where you are viewing the dashboard, making the process a bit more involved. Regardless, in our testing, this way of working was still miles faster than manually building the dashboard elements in the UI. Alternatively, it would probably also work to enable databricks bundle sync during this process to keep the dashboard in Databricks UI synced to your local changes.
Walkthrough
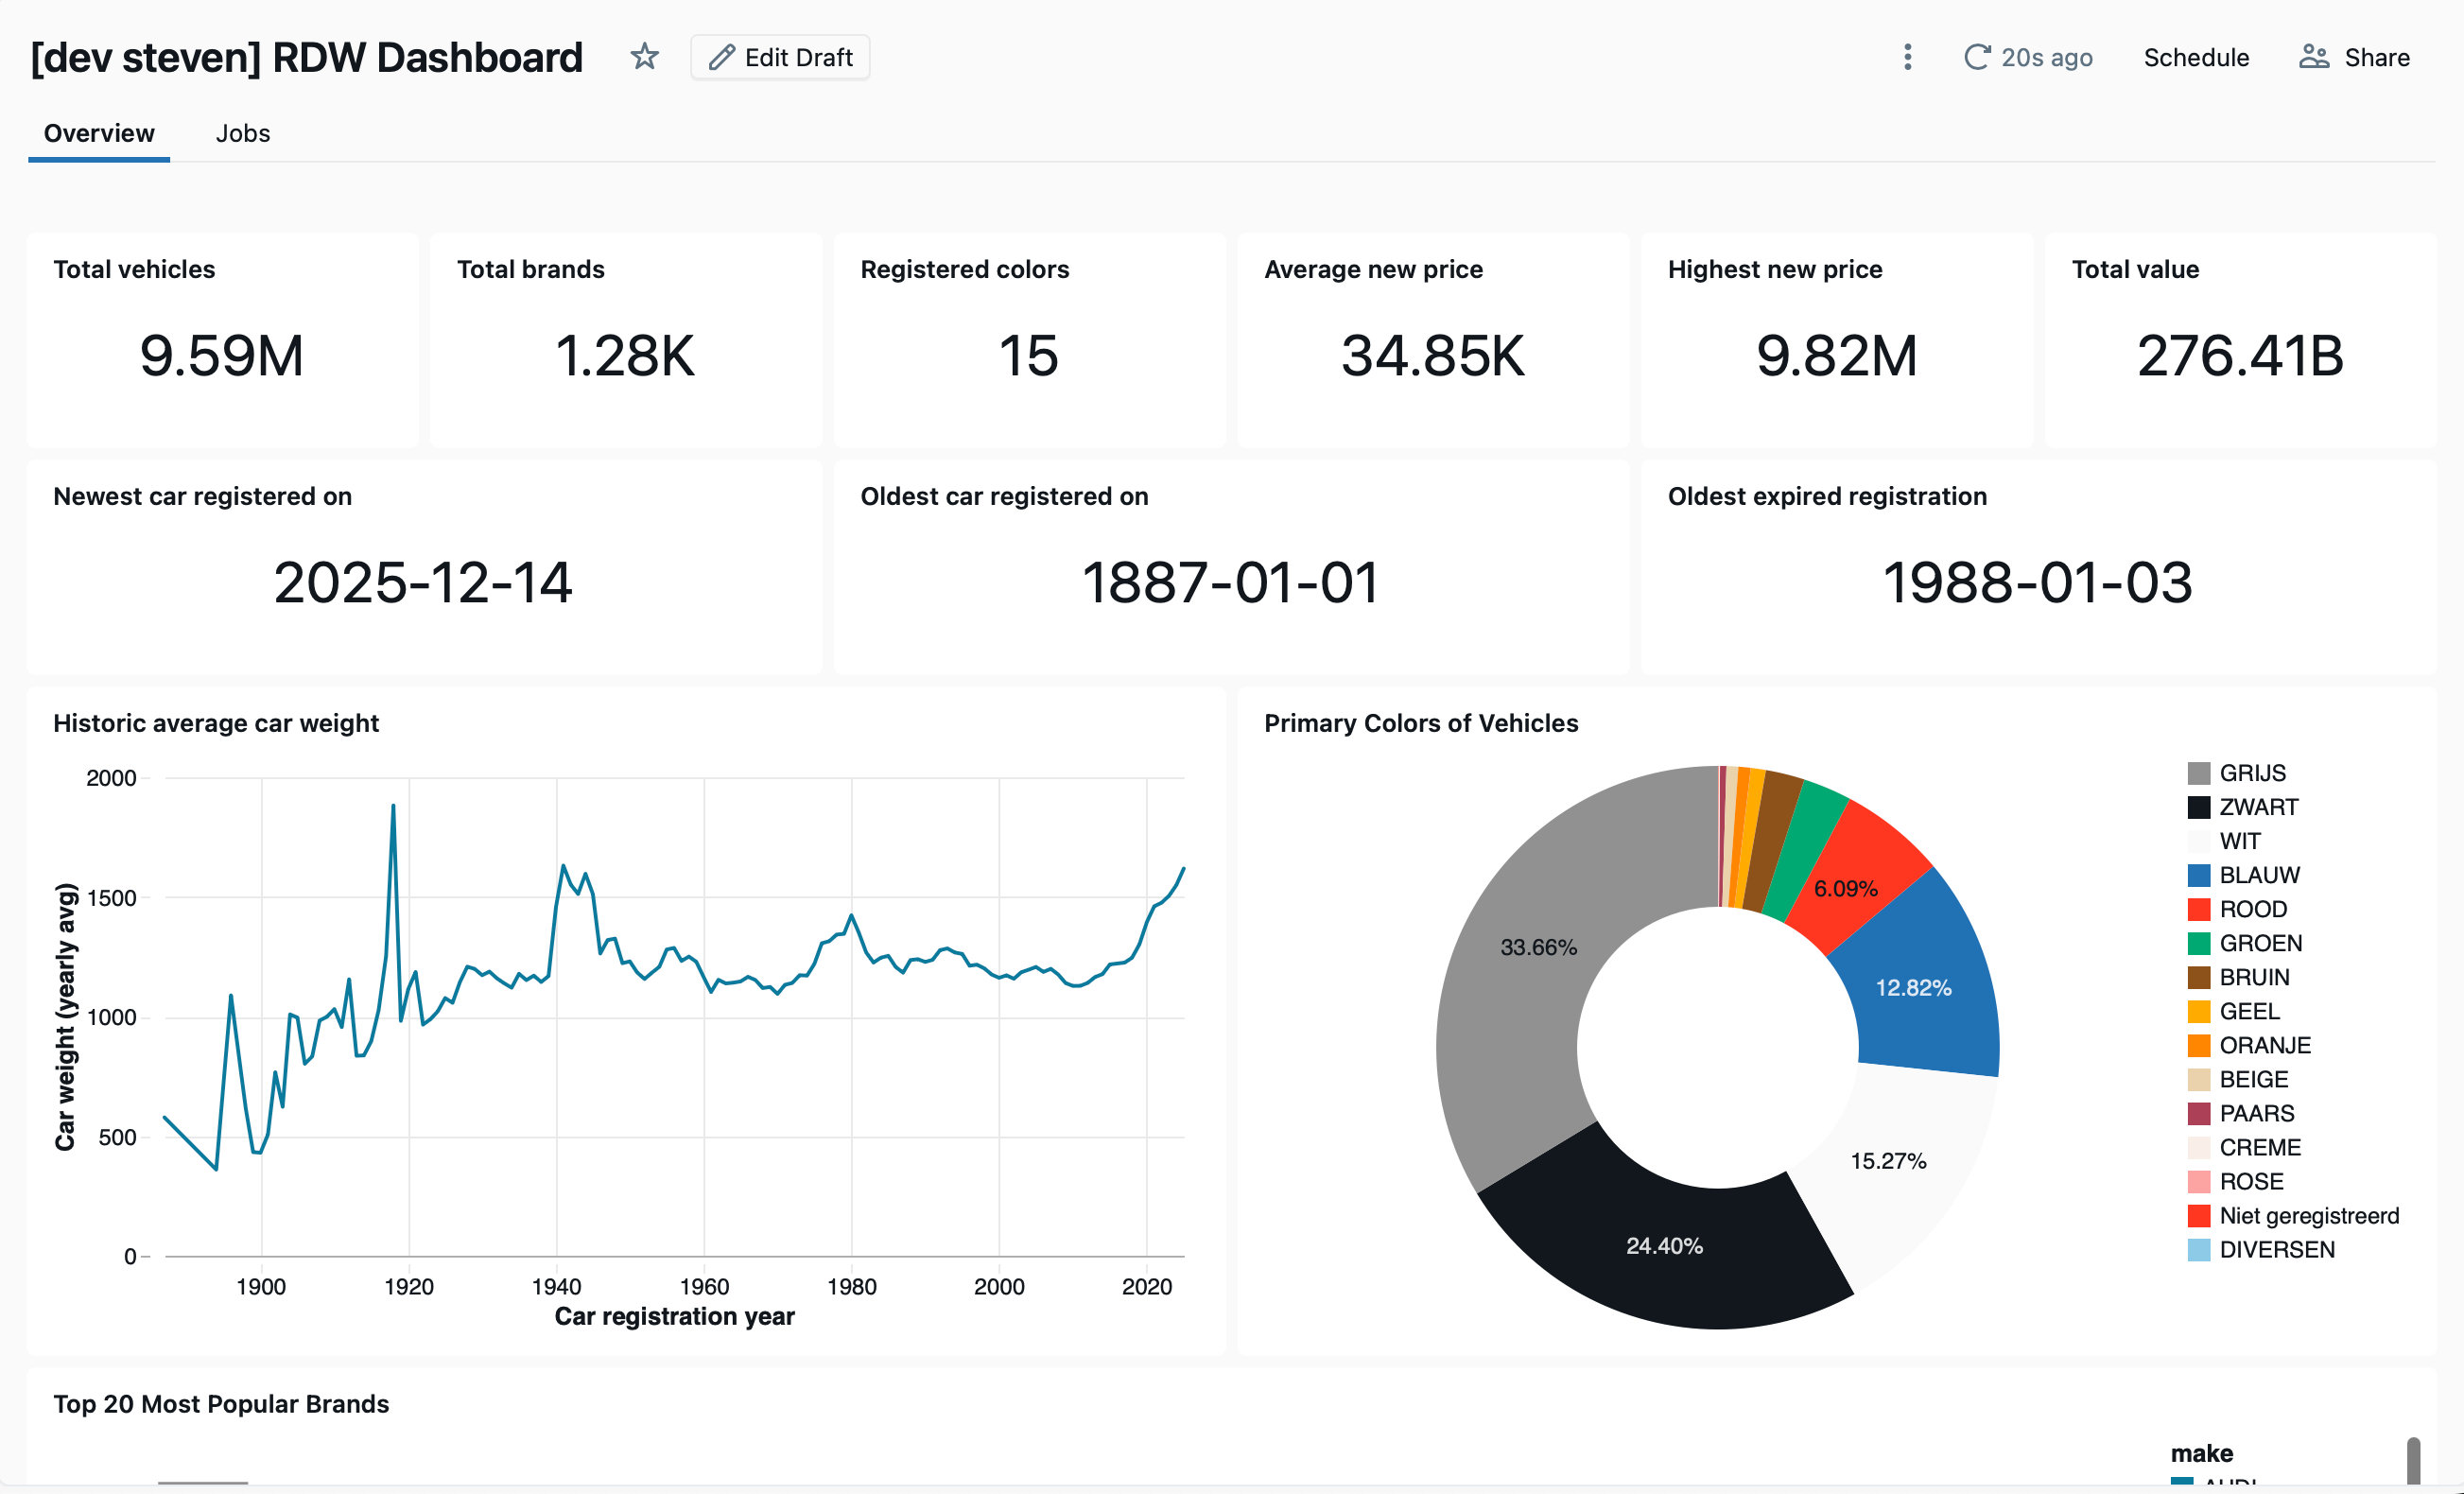
In our project we used Claude to build a job overview page. The overview page of our dashboard was built manually in the Databricks UI, and was given as a starting point for Claude. We recommend that you give Claude at least something (i.e., a few widgets) to start with, to help generate some context and syntax understanding. Whilst JSON rules are set, the dashboard syntax is not publicly available and hence we are essentially reverse-engineering it. This combined with a subagent in markdown (you could also use a skill) gave the best results for us. The subagent definition can be found here. The dashboard below was provided as context and created manually.
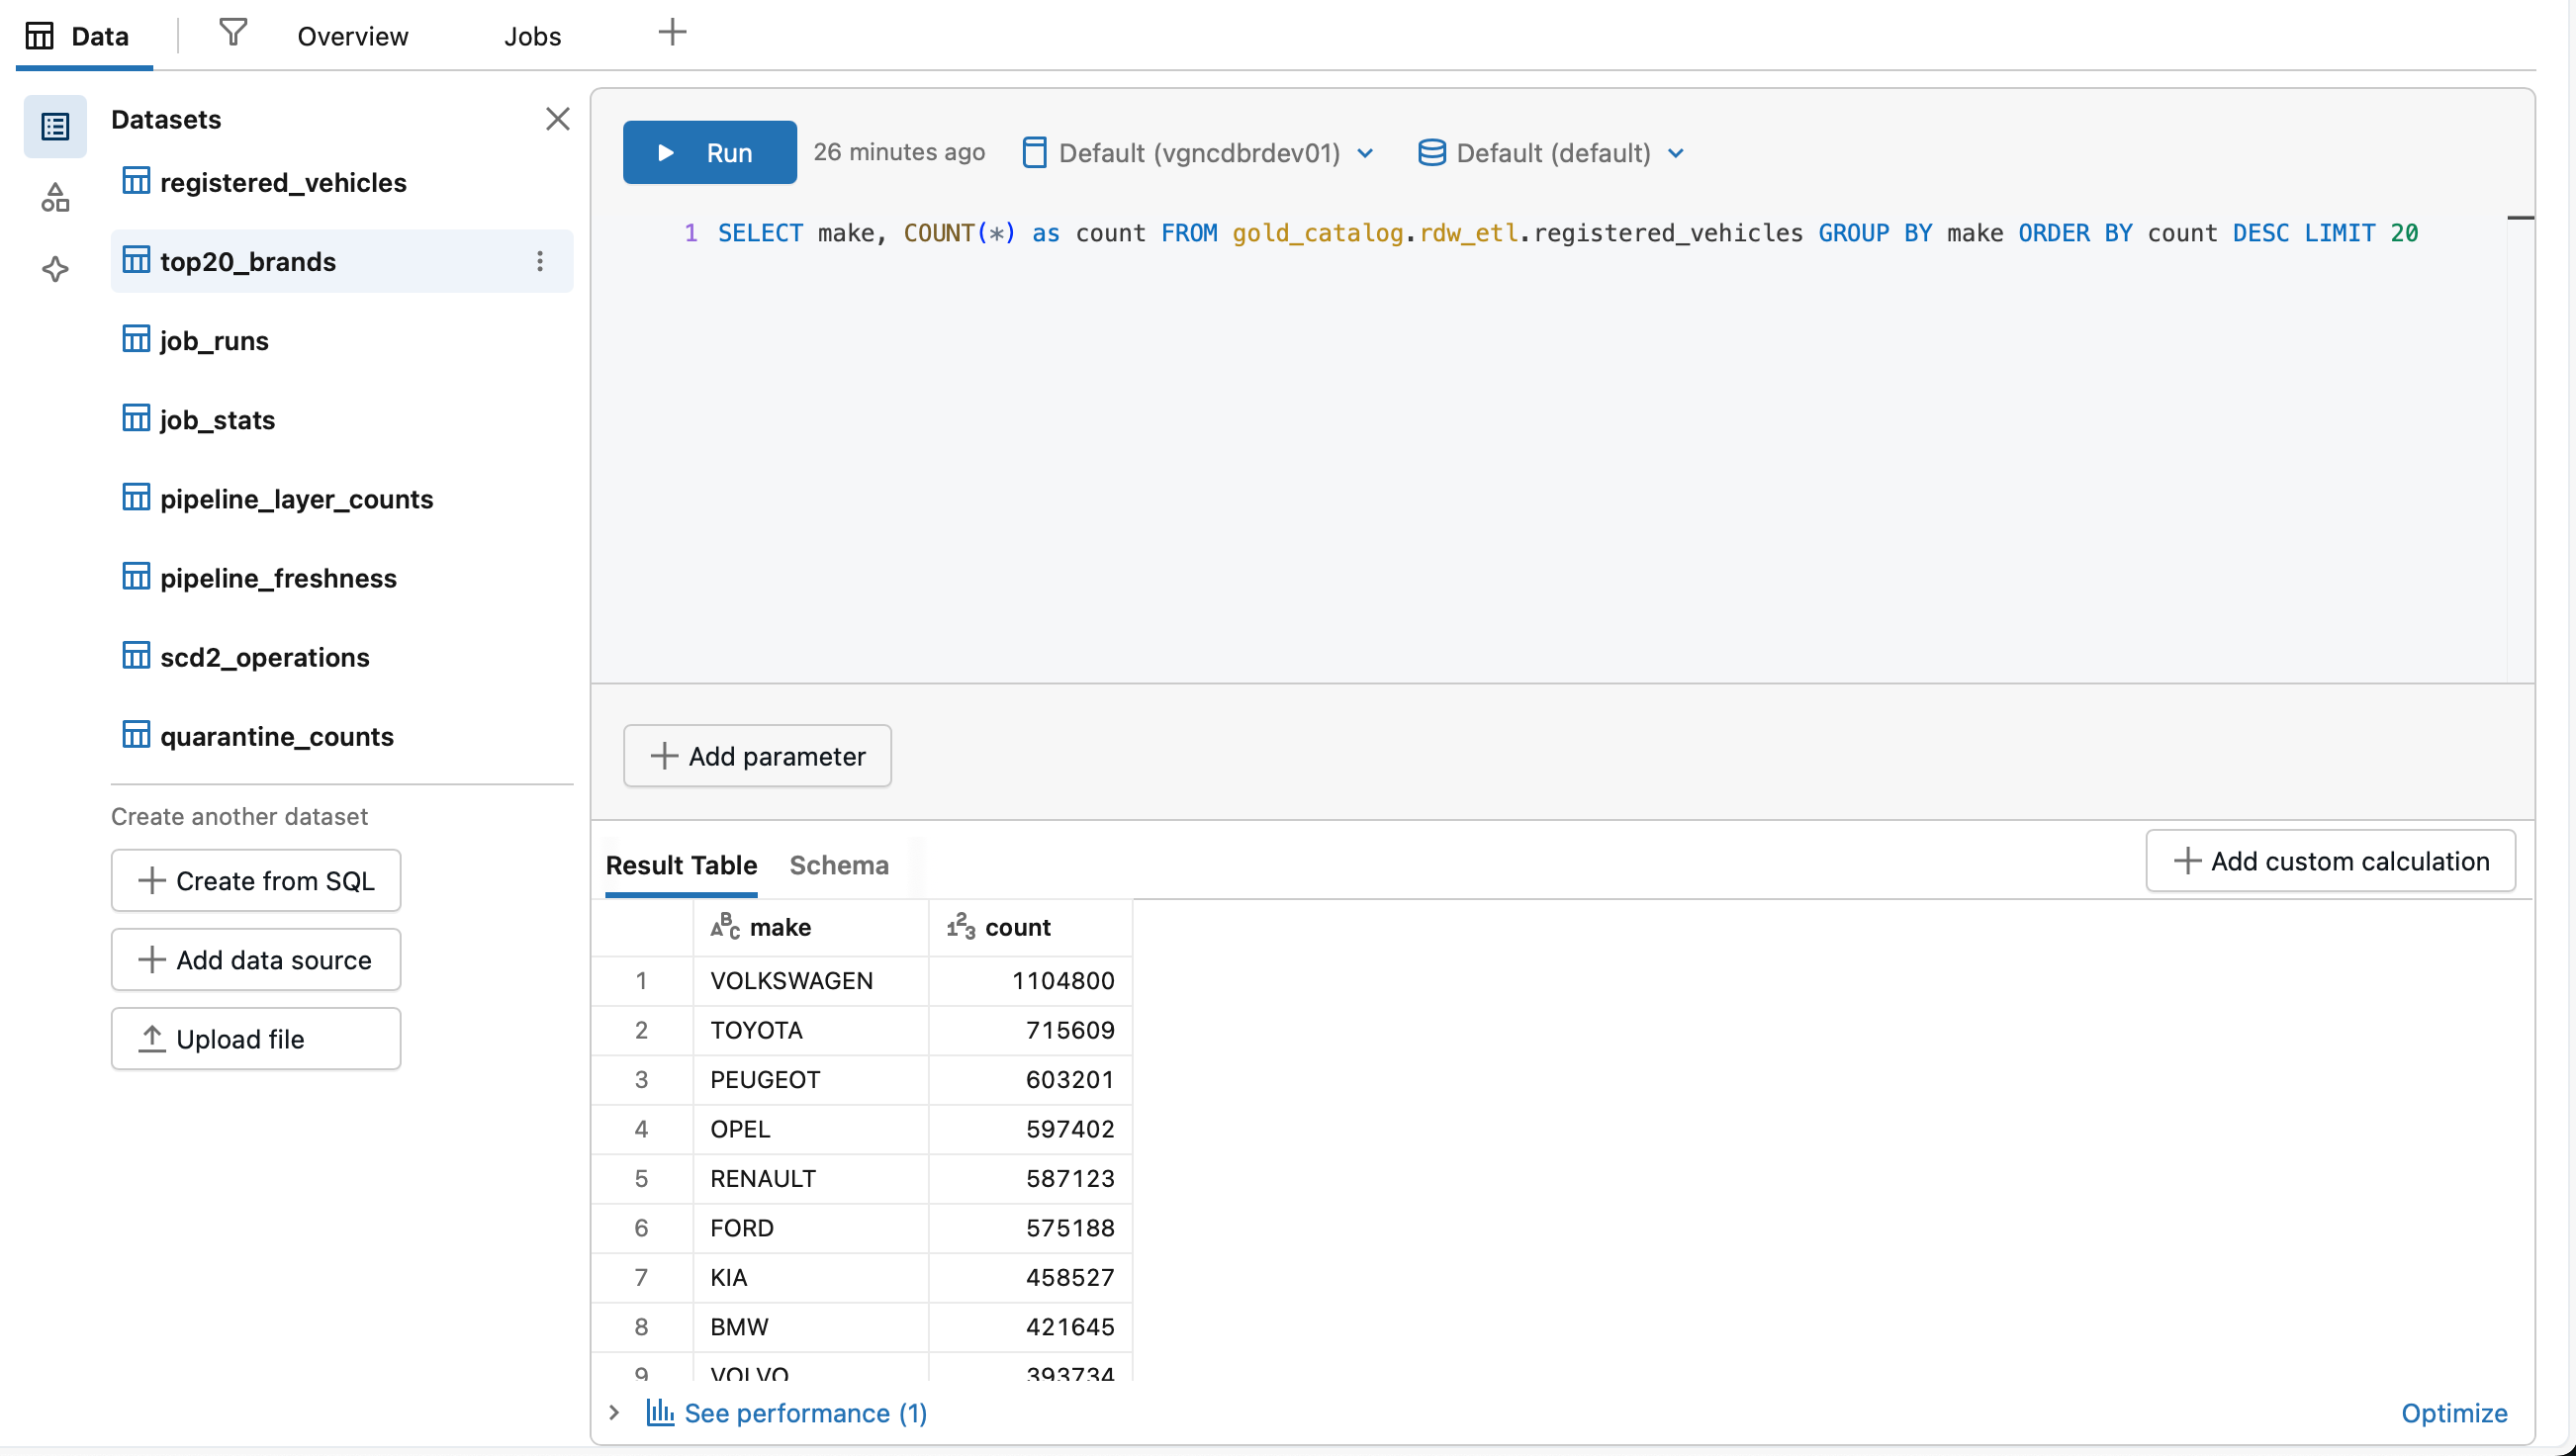
The first test we then conducted was for Claude to construct a “Top 20 Most Popular Brands” widget, which would involve both generating a widget and dataset. The first attempt yielded a correct widget with incorrect data, that showed all brands by popularity. We had to nudge Claude in the right direction and explicitly mention that it should generate a new dataset for this widget.
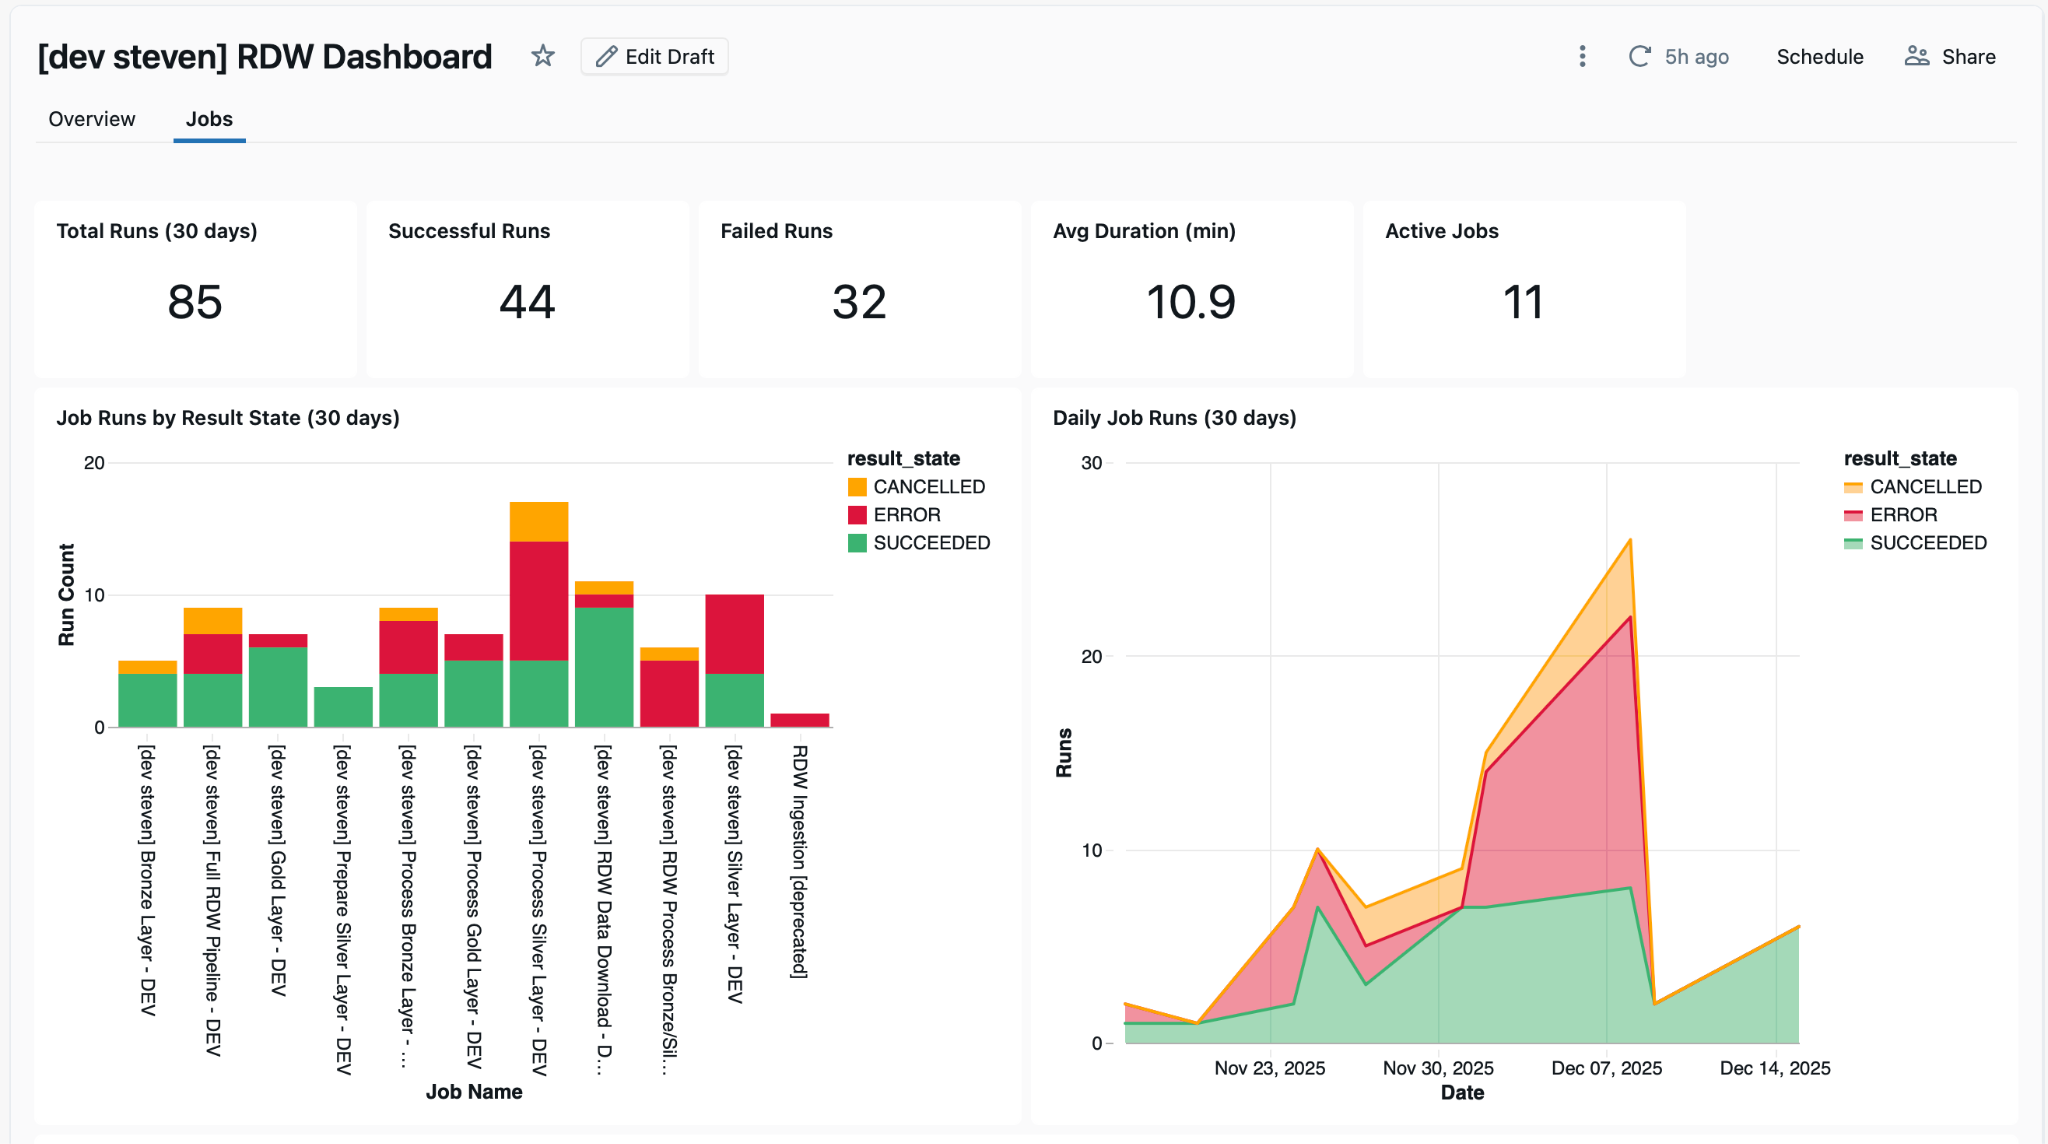
It was then time to let Claude loose on a new page for job overviews and statistics. We prompted to generate a job overview describing jobs in the current project (which can be read from databricks.yml), and use the system tables to automatically identify and construct datasets regarding metrics of these jobs.
The initial result was a decent overview page, though some widgets were still broken and could be positioned better. This was due to a line break syntax issue in the SQL queries. Having fixed that, the first results were genuinely impressive and very close to the end result. The tweaks thereafter were mainly focussed on layout, such as the color green/yellow/red colour scheme for visualisations, and improving the readability of scrolling widgets. We also found that the generated datasets could be simplified further. In the initial setup, Claude used one specific query per widget, and these could easily be refactored such that multiple widgets share queries/datasets.
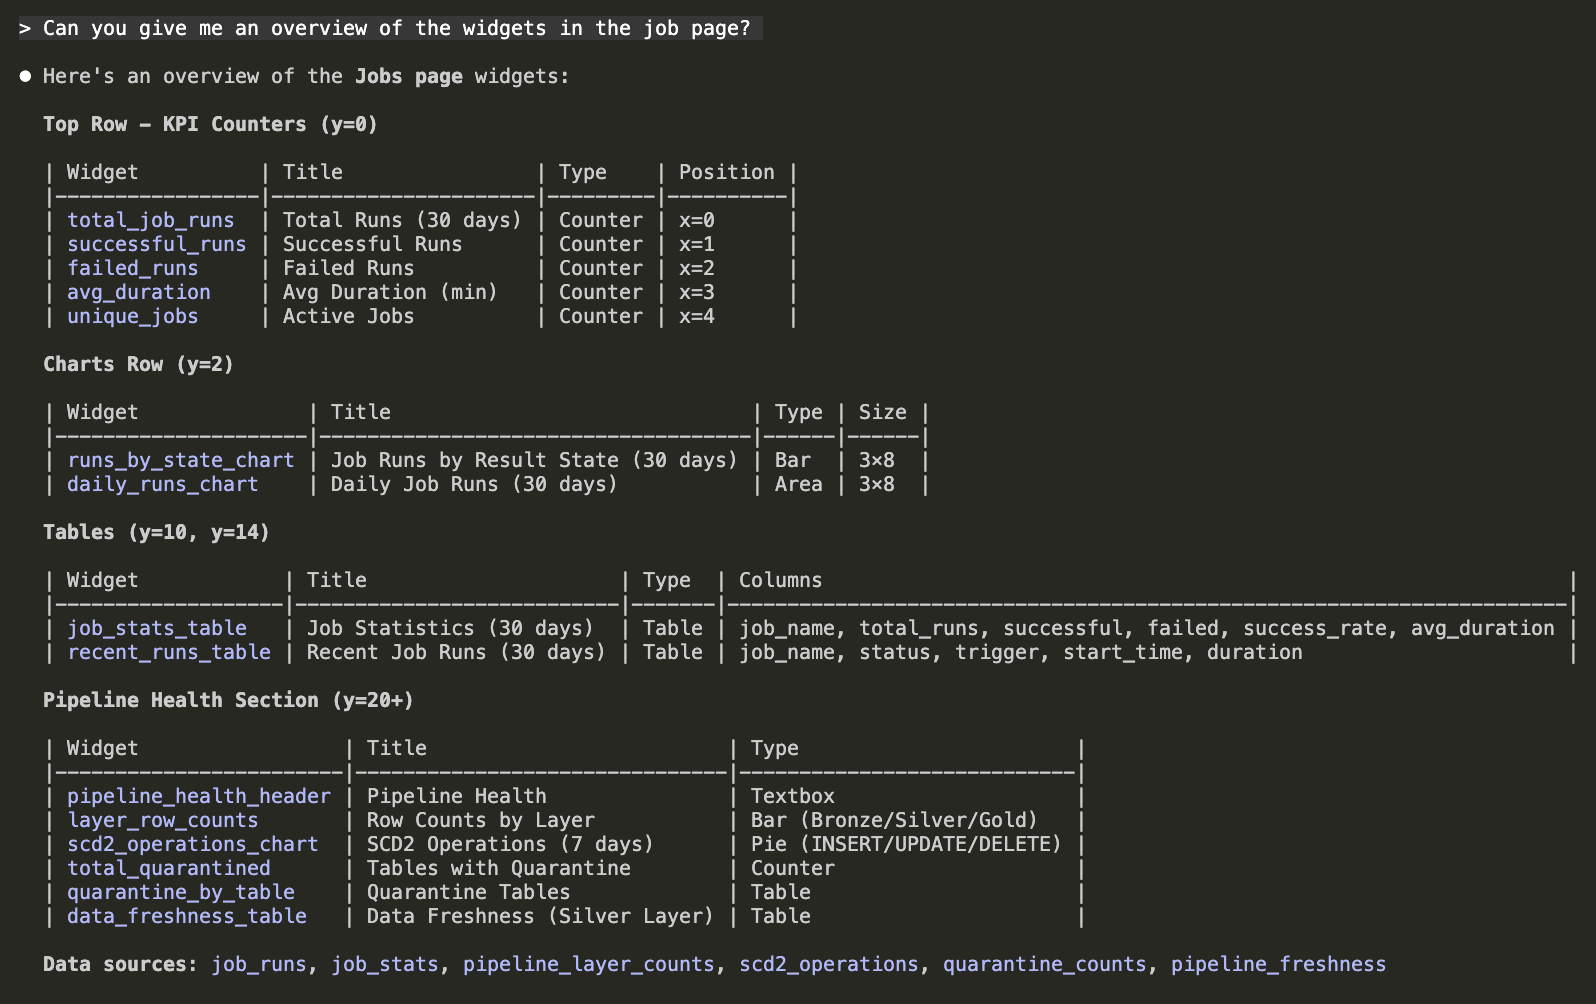
In order to avoid too much back-and-forth work between the UI and local JSON, it is also helpful to ask Claude to describe the current contents:
Results
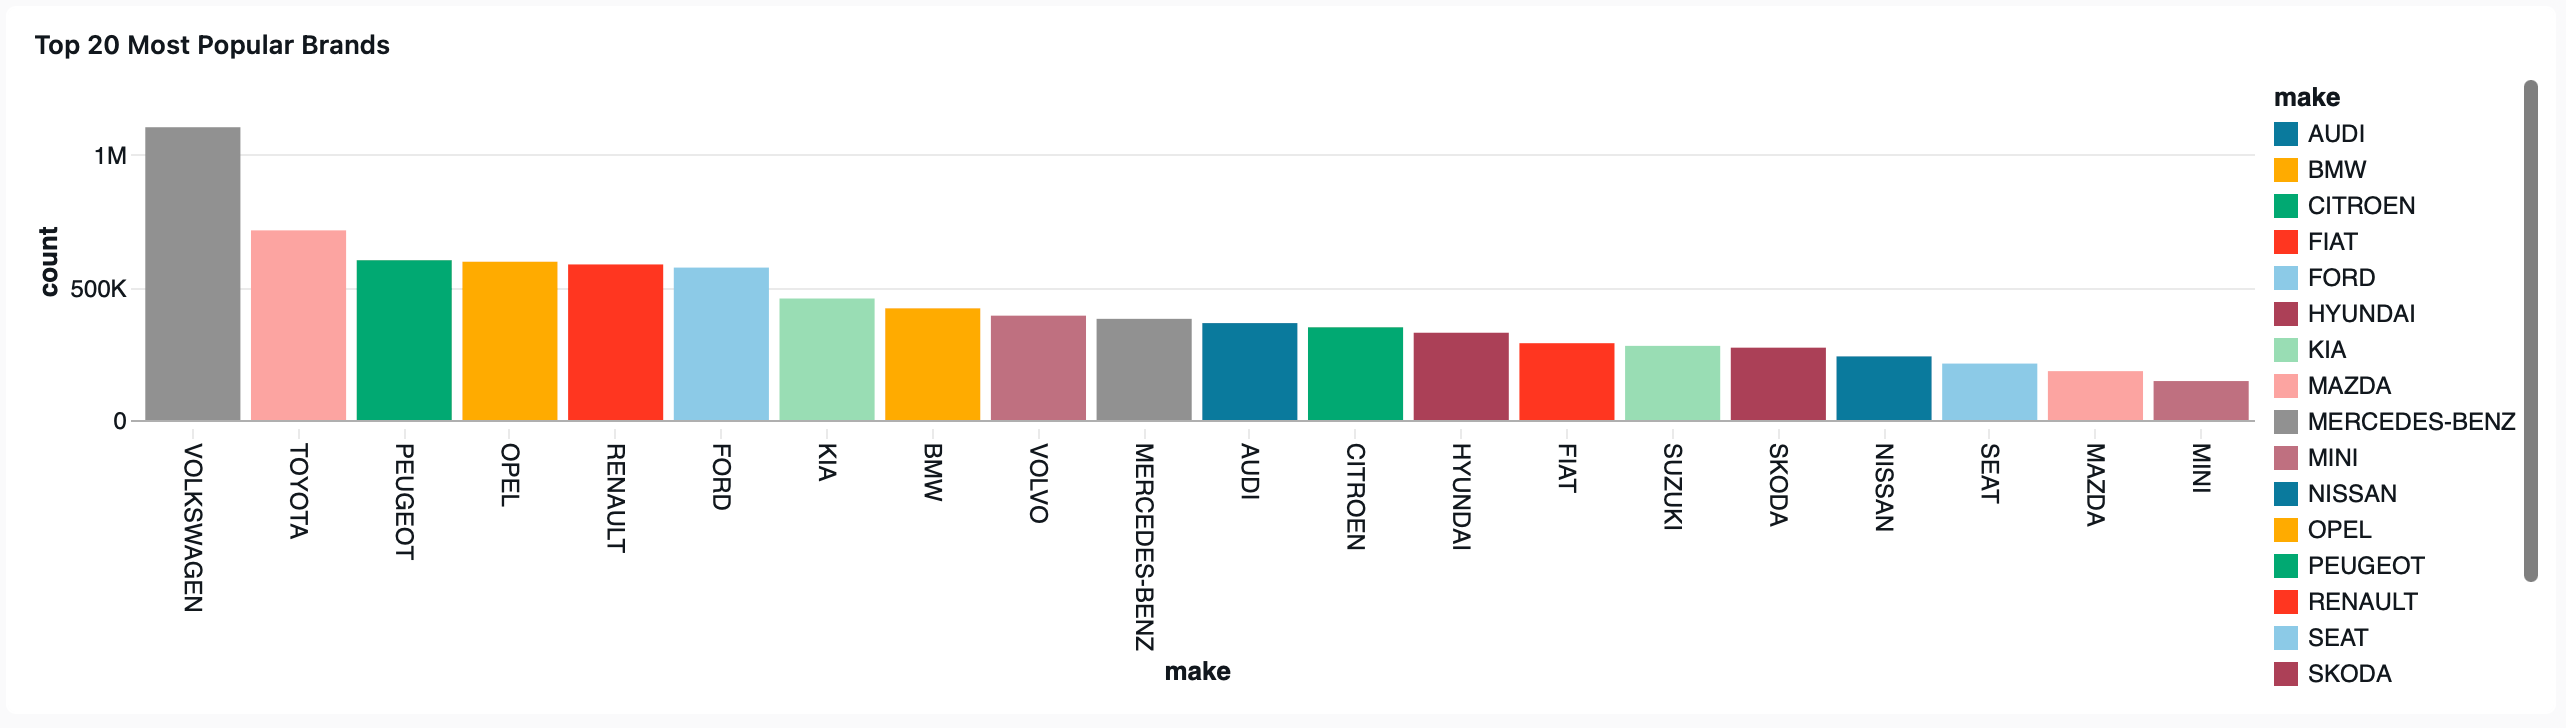
The results below show what we were able to achieve in only around 30-60 minutes of dashboard work using Claude code in combinations with the raw JSON source file for the dashboard. The initial experiment for most popular brands widget is shown below:
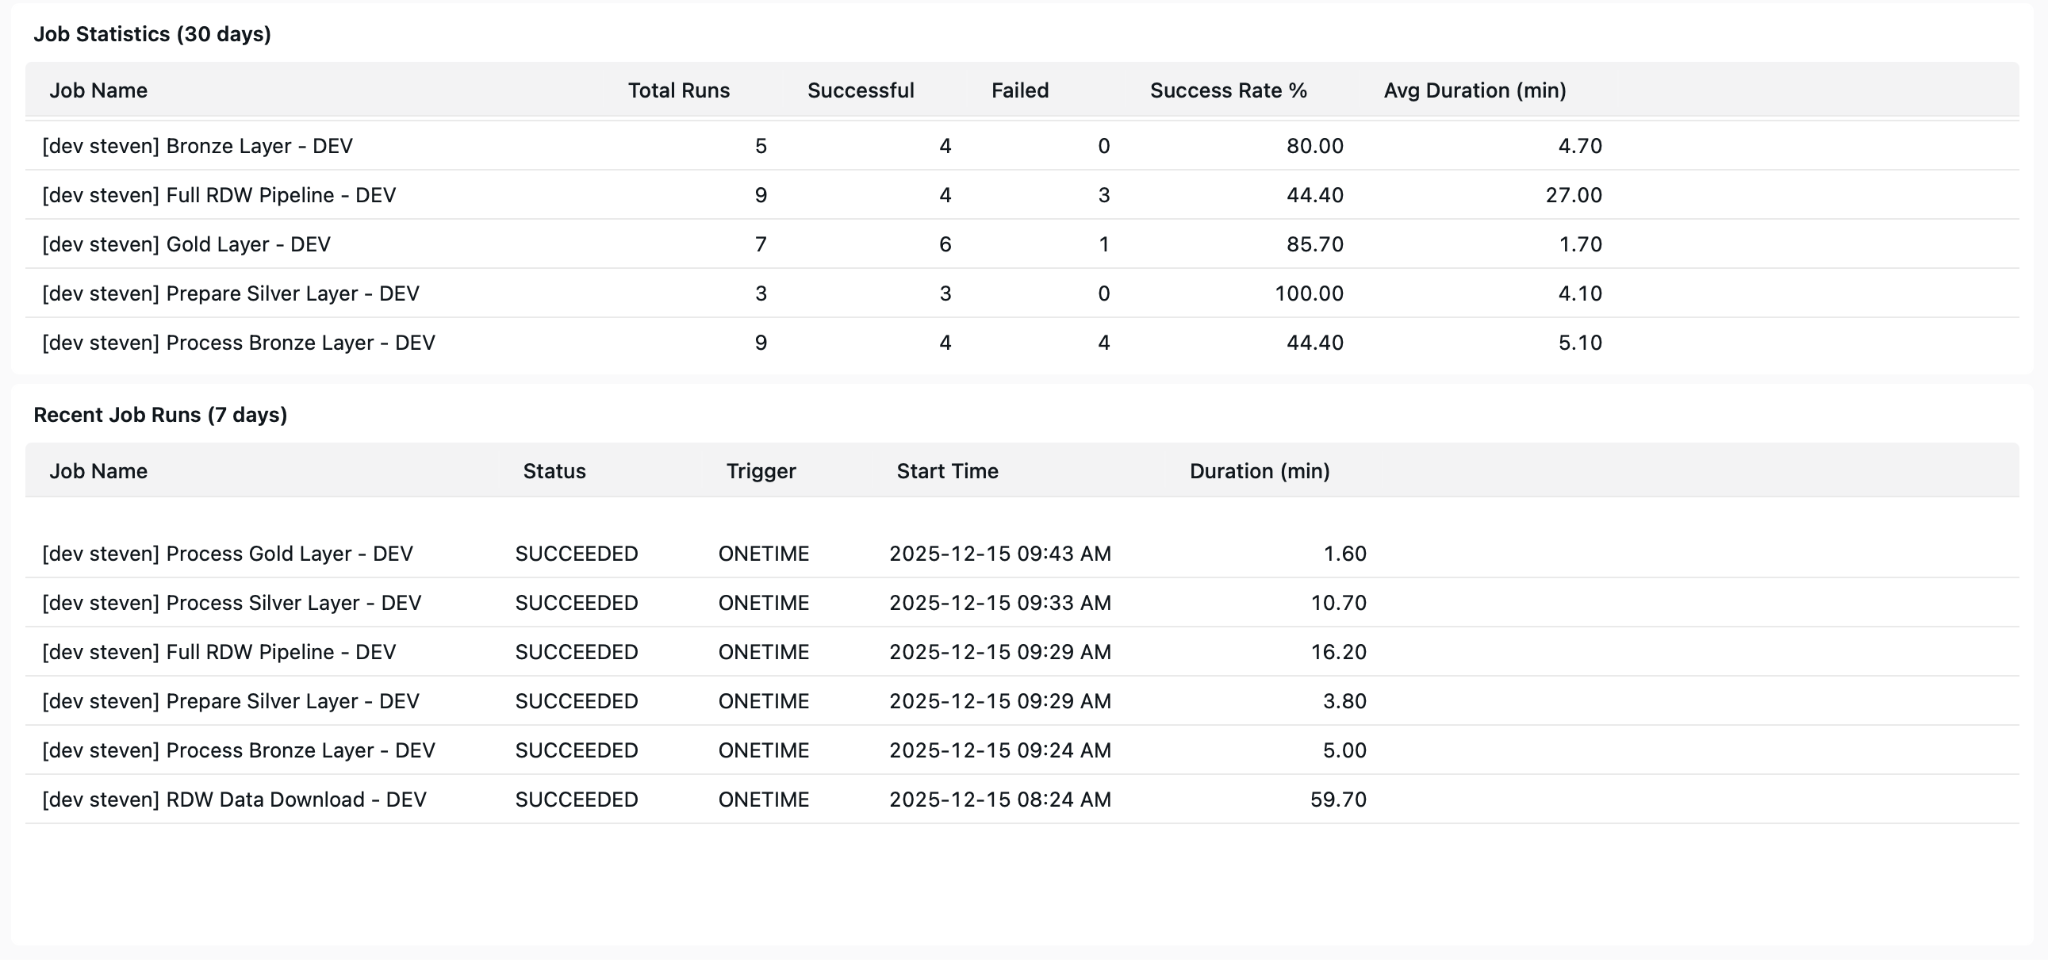
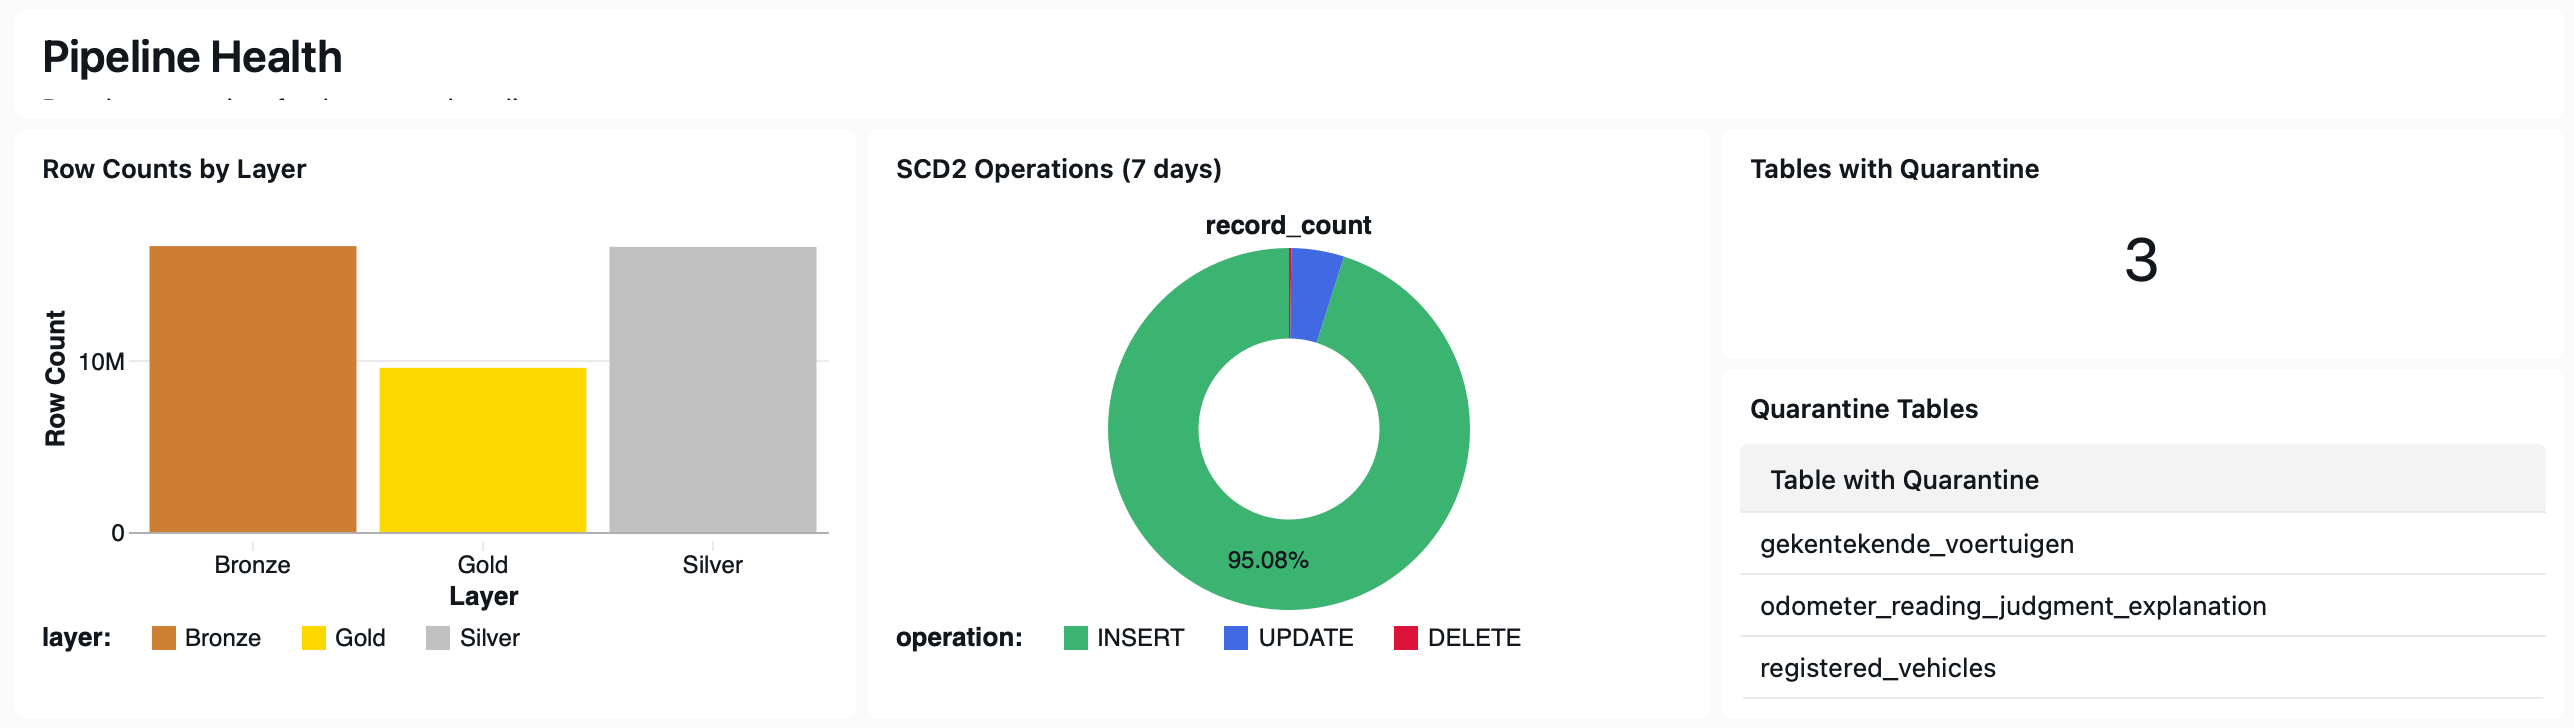
The generated job overview page included job run results and statistics. It also gave metrics about pipeline health, such as SCD2 operations and quarantined tables.
The full dashboard JSON along with the subagent we used is now visible in the repository as well.
Limitations
Obviously, there are some limitations to this approach:
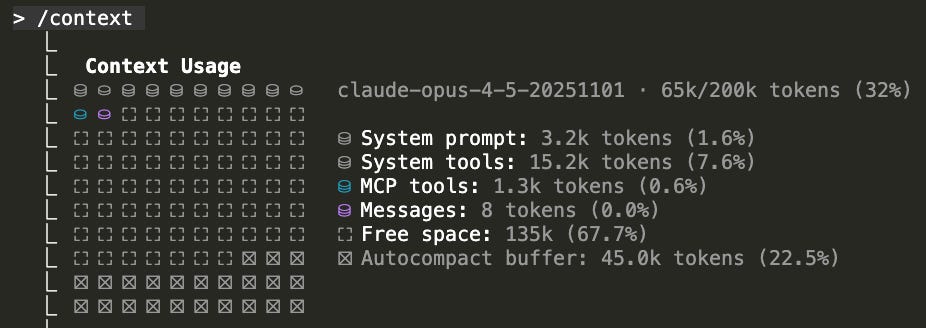
One of the first that we stumbled upon was dashboard size. We tried to work on the Account Usage V2 dashboard and modify it, but reading its JSON in Claude immediately flooded the context window with around 13.000 lines (and approximately 130.000 tokens) of reading required. This meant that it was not possible to work in the JSON file. There are probably ways to avoid this, such as splitting the pages in separate files, but it is still quite inconvenient and somewhat defeats the purpose of working with Claude, which is to be more efficient.
Even though this approach can make dashboard work much more efficient, the way of working is still not perfect. Altering the local JSON clone of the dashboard and reviewing changes in the Databricks UI can feel like a bit of a back-and-forth process where you keep switching between both. If adopting this method in your workflow, it would be very beneficial to implement a live view, similar to the approach by NextGenLakehouse in their recent video on LLM-assisted AIBI dashboard generation.
We also noticed that even with a Claude subagent, errors were not uncommon, especially in more complex widgets. This can be attributed to the lack of formal documentation for the dashboard JSON schema; you essentially have to reverse engineer rules out of existing dashboards. This also means that there is no tooling or official method for validating your JSON schemas for dashboards.
Conclusion
Using Claude Code as an assistant for building dashboards has been very effective in our workflow. Using the JSON representation of Databricks dashboards allows for a more programmatically approach to dashboards and hence give Claude, or any LLM coding assistant of choice, access to it. In our case we used Claude (supplied with a specialized subagent) both to polish an existing page and build a new page for our RDW project dashboard. This way of working allowed for extremely quick prototyping without manually diving into SQL queries and fiddling with widgets in the UI. We did run in to some limitations:
Large dashboards do not fit in LLM context window
Way of working is a bit of back-and-forth between local JSON and deployed Databricks dashboard to actually visualise it
Not perfect: Claude still makes errors with regard to the data and syntax sometimes
In general, we can recommend the approach when you need to:
Tweak or adjust existing dashboards - though dependent on its length.
Obtain quick visualisations and insights to answer questions from stakeholders in a matter of minutes.
As of currently, we would not recommend it when:
Building completely new dashboards with convoluted metrics from scratch - Claude performed significantly better in existing environments where it could deduce information from. If you want to try this it is beneficial to explore your plans and data first with Claude.
Working on very large dashboards (>10K lines of JSON, depending on your model) where the LLM context window may not suffice.
In the upcoming blog posts we will dive deeper into various aspects of the project, such as a data exploration webapp, Databricks Asset Bundles (DABs), and cost analysis.